Bei EXIAS Medical verschieben wir Tag für Tag die Grenzen analytischer Präzision – wir entwickeln Diagnostiklösungen, auf die sich Labore, Point-of-Care und Tierkliniken weltweit täglich verlassen. Doch hinter jeder Innovation steht ein Team, das weiß, wie man hart arbeitet, einander unterstützt – und genauso wichtig – gemeinsam feiert.
Genau das haben wir diesen Sommer getan.

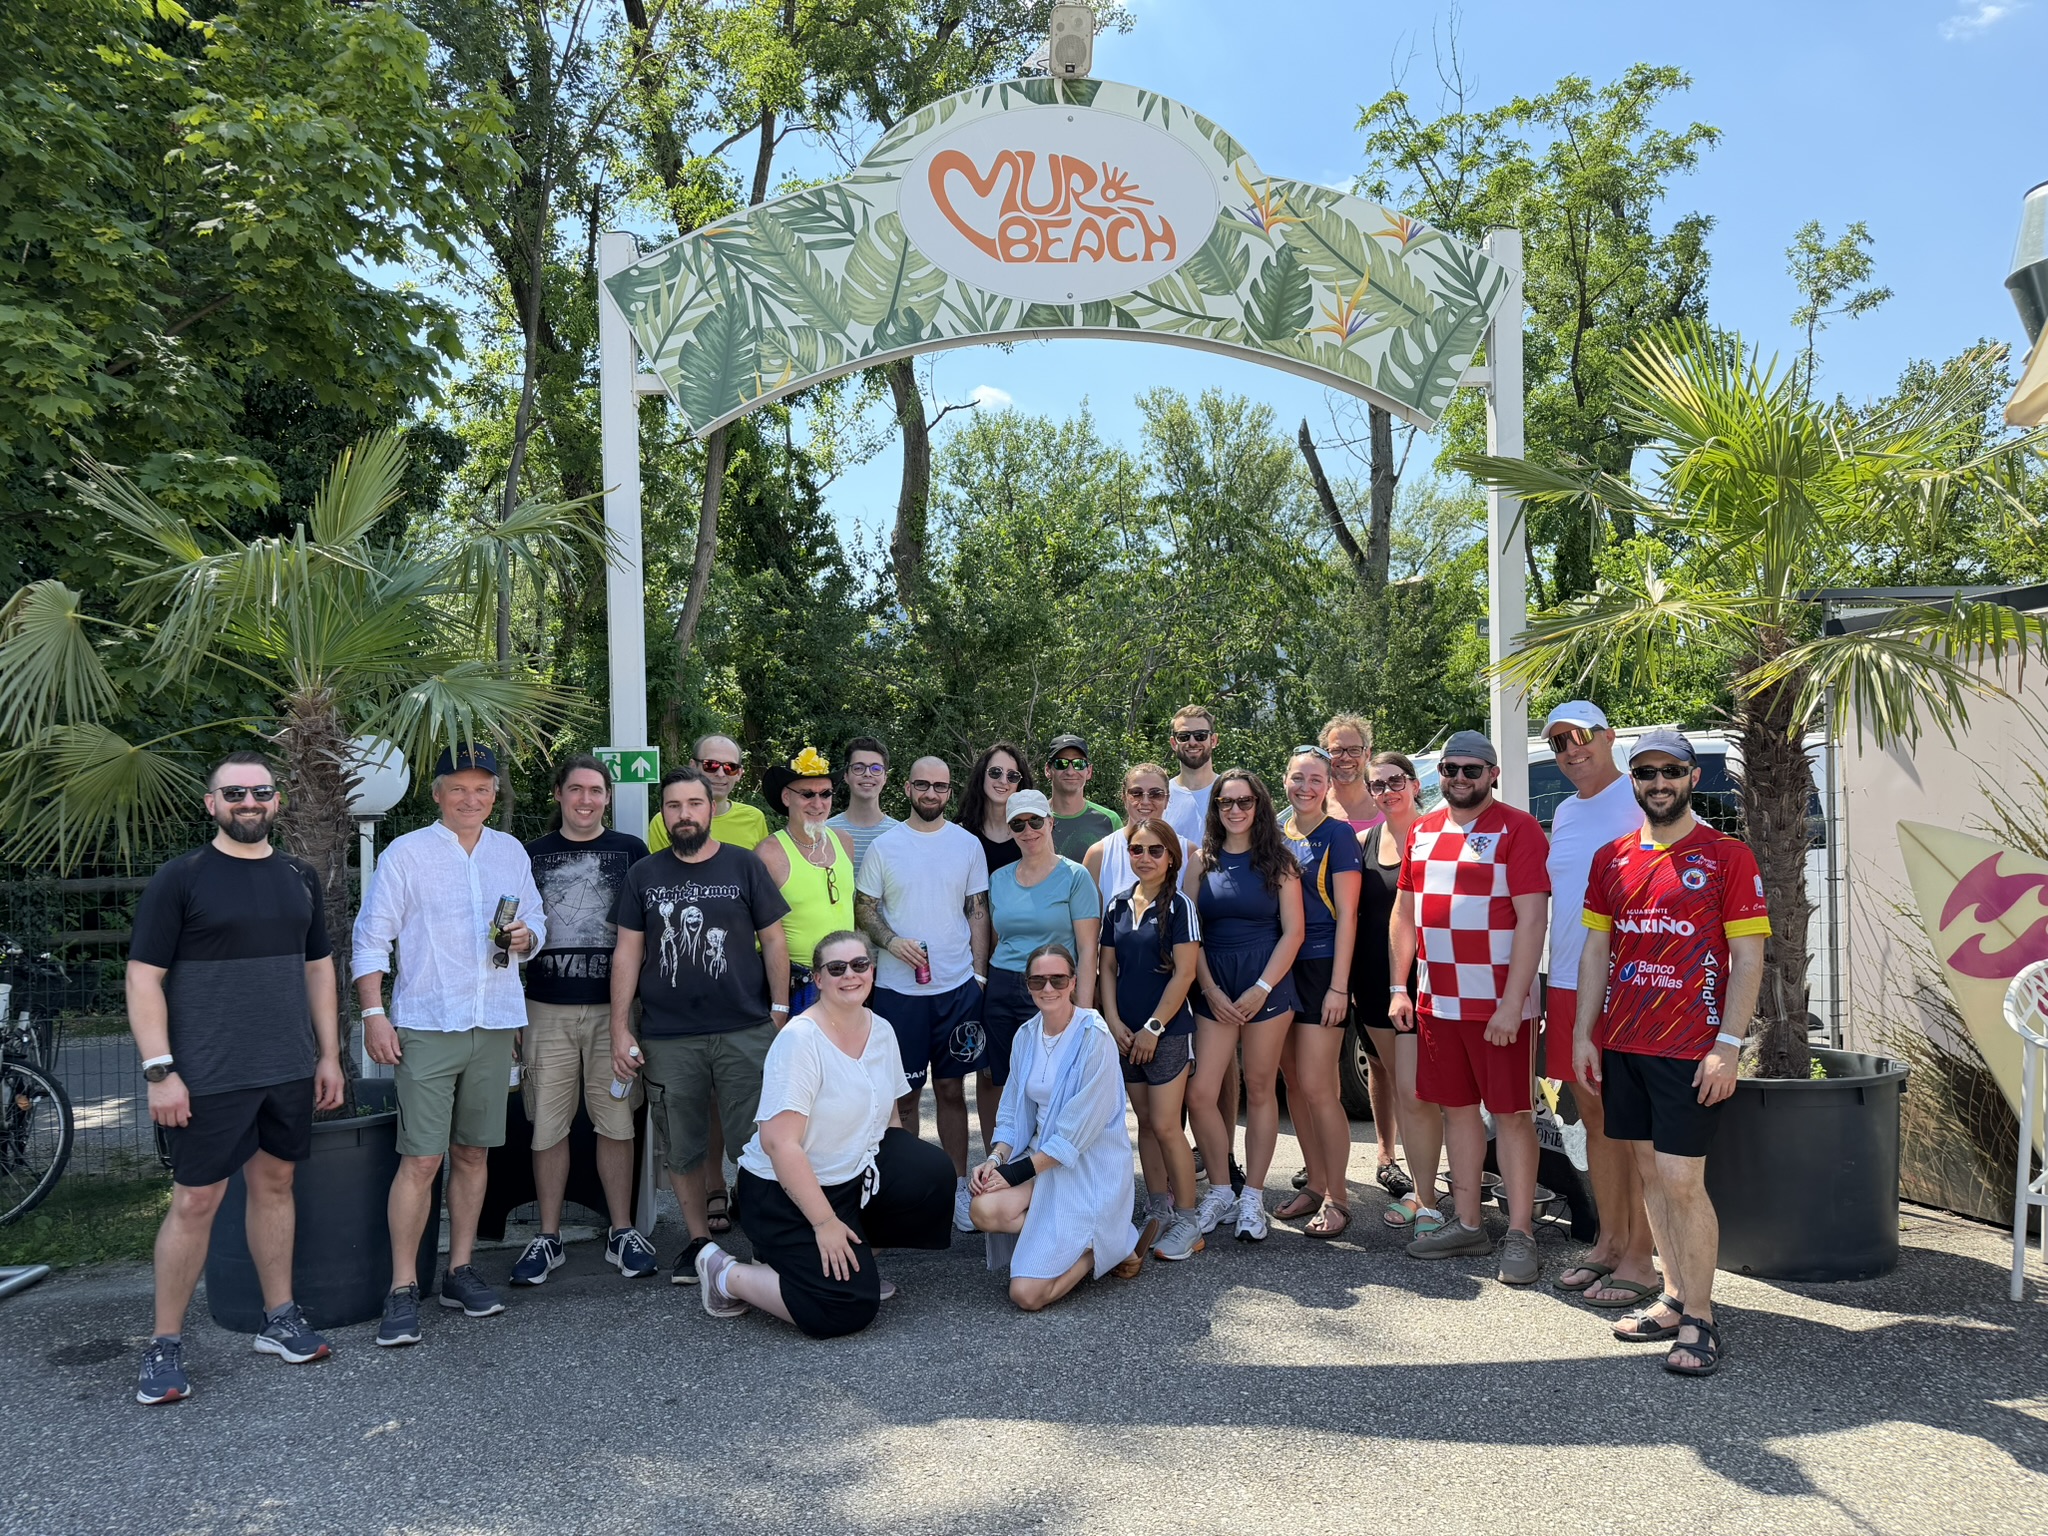
Sonne, Spaß & Teamgeist
Bei strahlendem Sonnenschein begab sich das EXIAS-Team zum Mur Beach um einen Nachmittag voller Sport, Teamgeist und gemeinsamer Zeit abseits des Arbeitsalltags zu genießen. Und der Tag hielt, was er versprach: jede Menge Spaß und ein Teamspirit, das nur entsteht, wenn man gemeinsam das Büro gegen Sonne eintauscht.
Es zeigte einmal mehr, was dieses Team im Kern ausmacht: Menschen, die ihren Teil beitragen und sich gleichzeitig auf die anderen verlassen können. 🤝
EXIAS vereint Innovation und Leidenschaft
Was uns verbindet, ist die Leidenschaft für innovative IVD-Lösungen. Genau diese Leidenschaft ist es, was uns jeden Tag aufs Neue befeuert, über den Tellerrand zu blicken, um Diagnostikgeräte der nächsten Generation zu entwickeln und dadurch einen nachhaltigen Beitrag zu Gesundheit weltweit zu leisten. Das gelingt nur mit Präzision, Engagement und einem Team, das sich aufeinander verlassen kann. Diese Leidenschaft zeigt sich nicht nur in unseren Produkten, sondern ist täglich im Arbeitsklima zu spüren, egal ob in Forschung & Entwicklung, Marketing, Vertrieb oder Logistik. Gemeinsame Momente wie das jährliche Sommerfest geben uns die Möglichkeit diese Verbindung zu feiern und gemeinsam neue Energie zu tanken.
Werde Teil eines Teams, das Erfolge gemeinsam feiert
Bei EXIAS Medical sind wir überzeugt: Innovation entsteht dort, wo Menschen sich verbunden, wertgeschätzt und unterstützt fühlen – im Job und darüber hinaus. Wenn Sie einen Arbeitsplatz suchen, an dem Präzision auf Leidenschaft trifft und harte Arbeit mit echtem Teamgeist Hand in Hand geht, freuen wir uns, von Ihnen zu hören.